Vimmersa Masterplan + Consensus
See the options. Hear everyone. Decide together.
Design planning scenarios on official city data, show them side by side in 3D, photoreal pictures and VR, and let everyone vote from one link — before decisions are locked in.
Demo Quarter · 8.7 ha · 3 scenarios
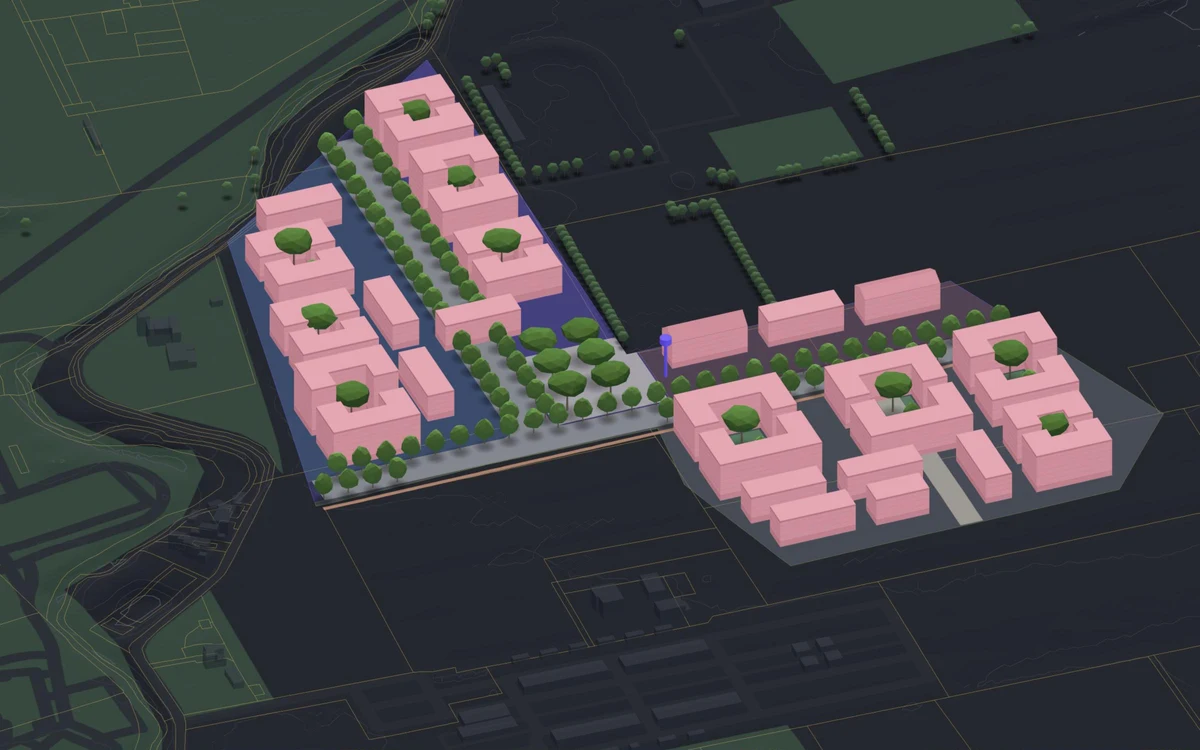
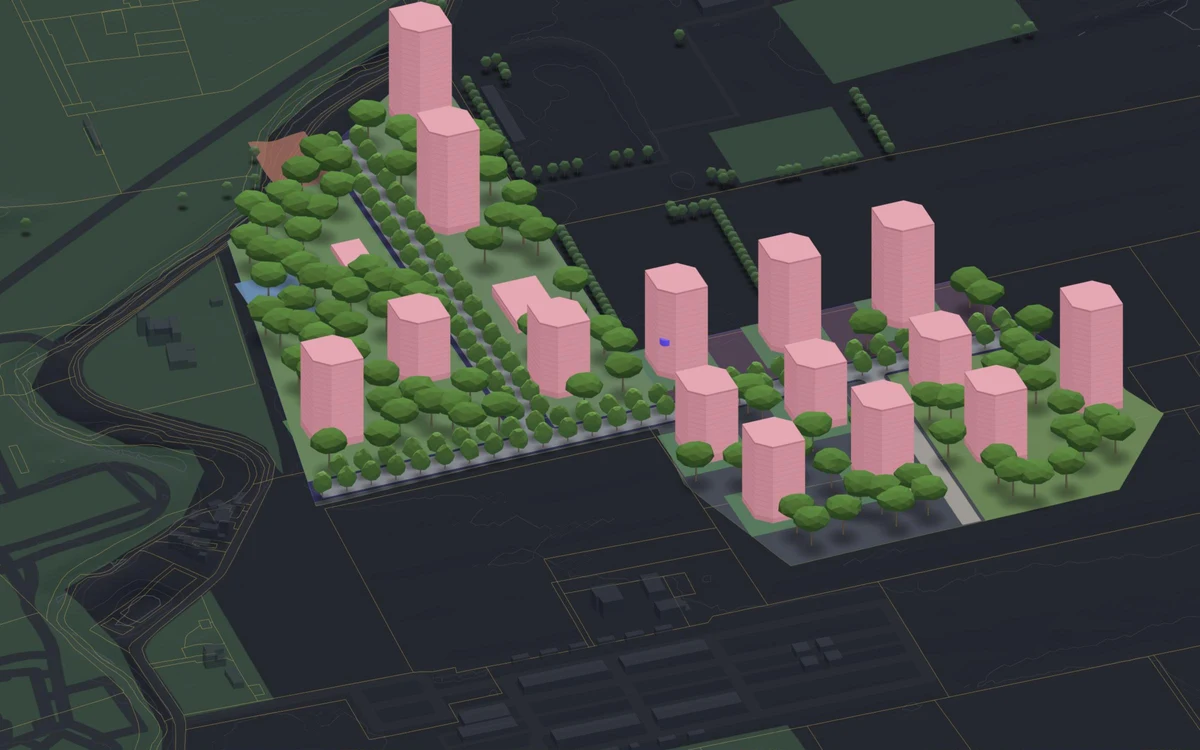
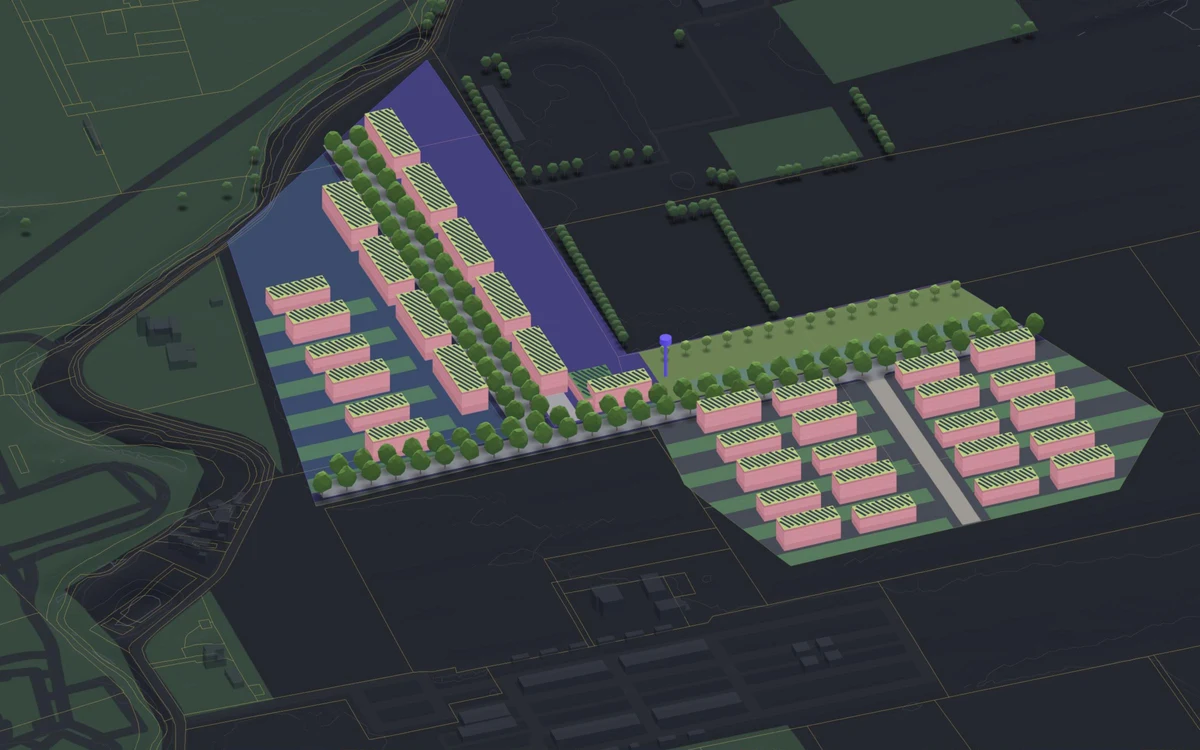
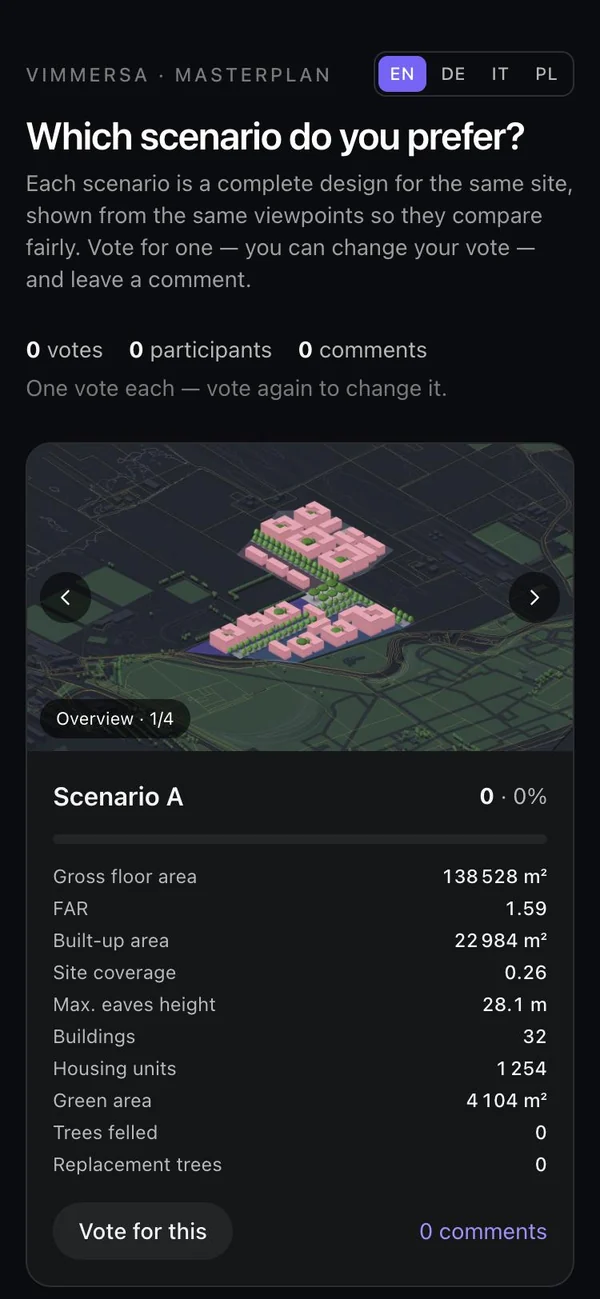
Scenario A · Blocks & square
Courtyard blocks of five to nine storeys around a square, shops along the boulevard.
- GFZ
- 1.59
- Max. storeys
- 9
- Dwellings
- ≈ 1,254
- Green space
- 4,104 m²
Drawn from the demo quarter's Masterplan data — three scenarios for the same 8.7 ha site.
In the browser · no install · EN · DE · IT · PL
Masterplan
From the site to a shared decision
All in the browser — here is the demo quarter at each step, and below, what participants get.
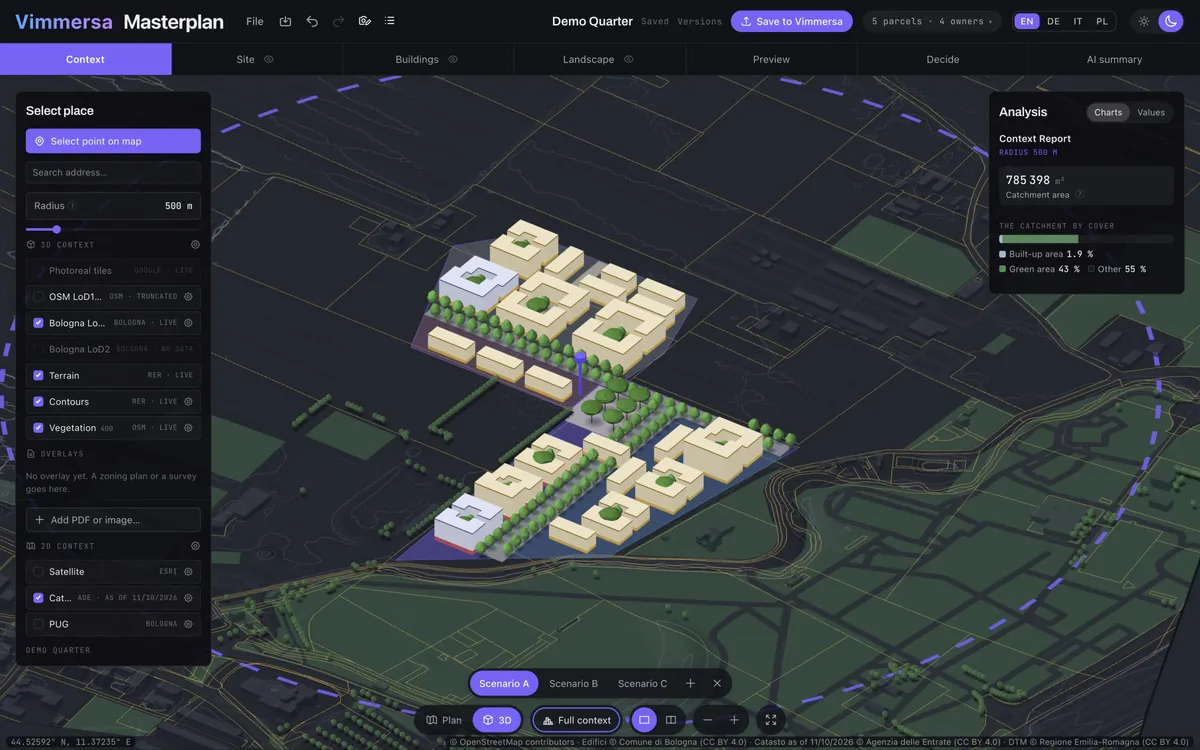
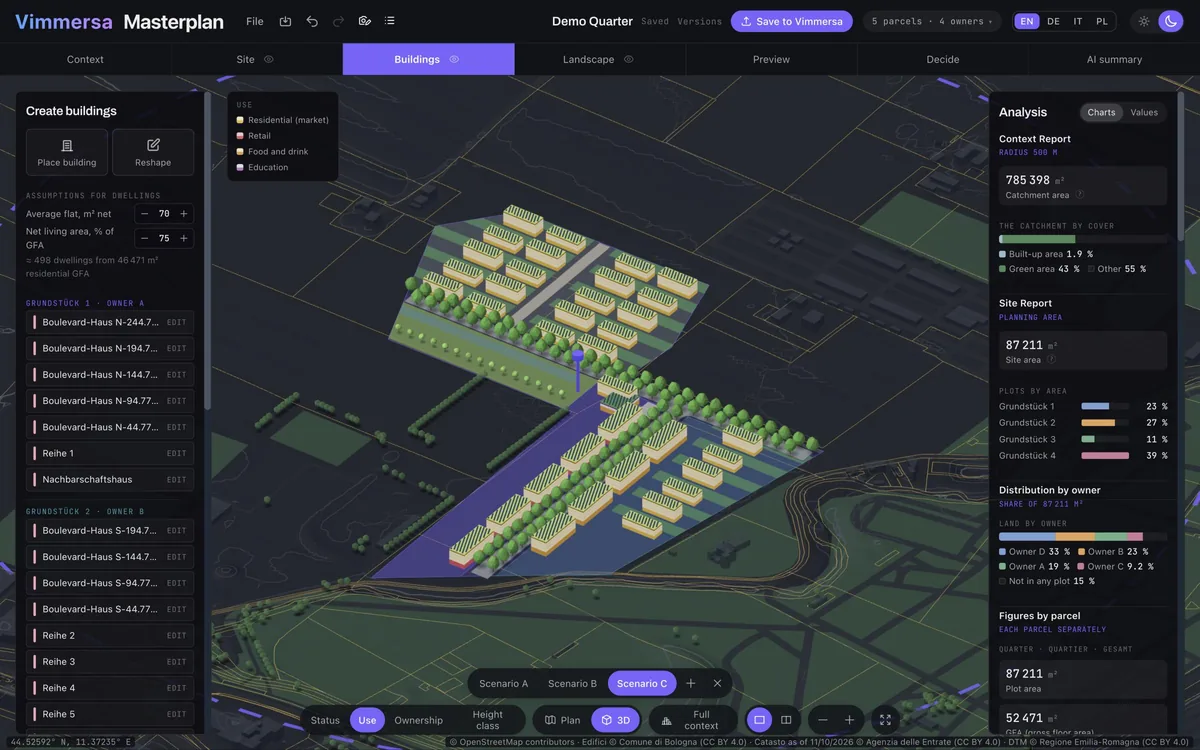
Context: the city around the site from official data — the municipal building model, terrain and contours, the cadastre — with the context report alongside.
Visualize · VR
From massing to a picture people understand
Most people cannot read a massing model. Show them a photoreal picture of the scenario, or let them stand in the street in VR.
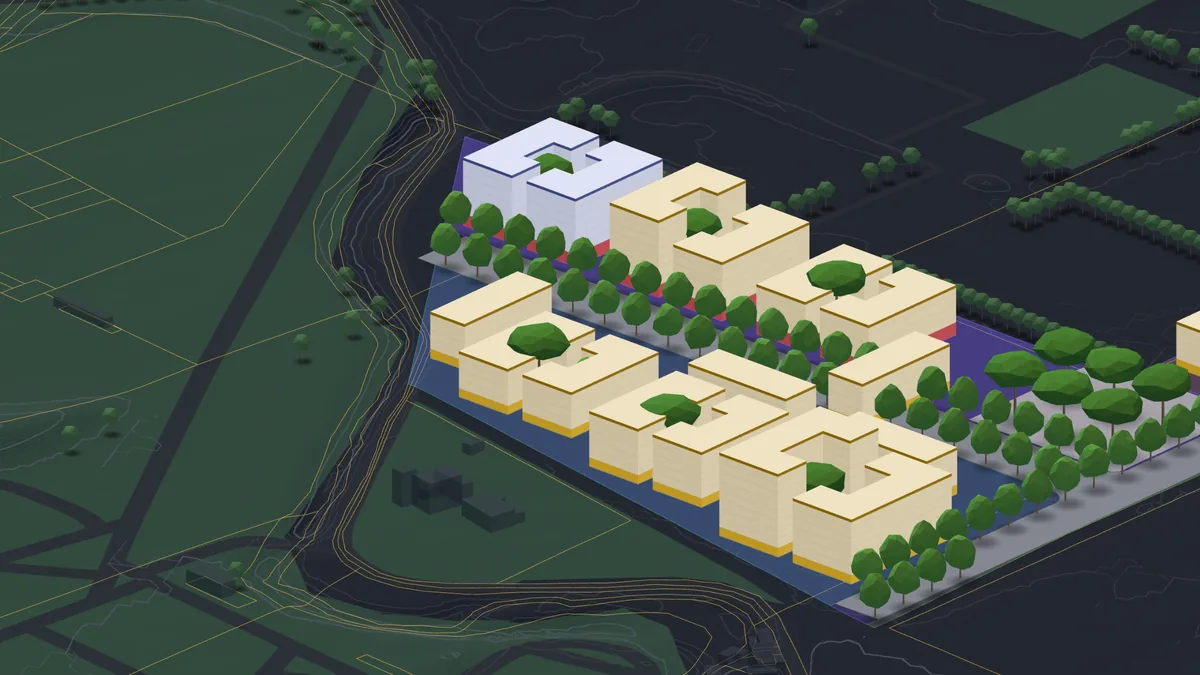
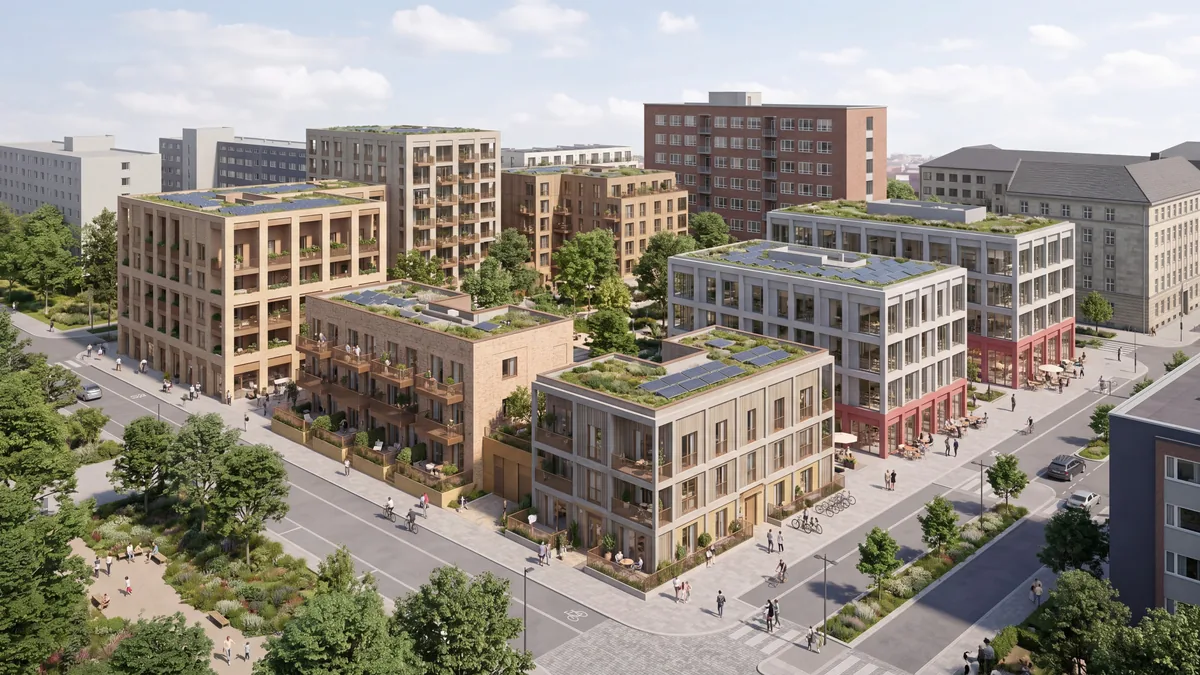
Scenario A of the demo quarter: the saved view in Masterplan, and what Visualize made of it.
Photoreal in one click
Visualize turns a saved view into an architectural visualization of the scenario — daylight, materials, greenery and life — from the view’s massing and camera.
Stand in it, in VR
Every scenario’s 360° opens in the Vimmersa viewer — on a phone, a laptop or a VR headset such as Meta Quest — at street level, where the decision is felt.
Walk the 3D model
Each scenario also goes into the Vimmersa tour as a 3D model in its real surroundings, to orbit, step inside and walk through in the browser.
Consensus
What participants see
One click publishes every scenario with its pictures, 360° and figures. Residents, owners and councillors get the same view of every option the planners have — on the phone in their pocket.
One link, no sign-up
A resident opens the link on their phone. No app, no account, nothing to install.
Every option, side by side
Each scenario with its pictures from the same viewpoints, a 360° to stand in — on the phone or in a VR headset — and its key figures.
One vote each — and a voice
One vote per person, which they can change, and comments on a scenario or on the whole proposal.
In their language
English, German, Italian and Polish — the same page, switched with one tap.
The figures planners argue about
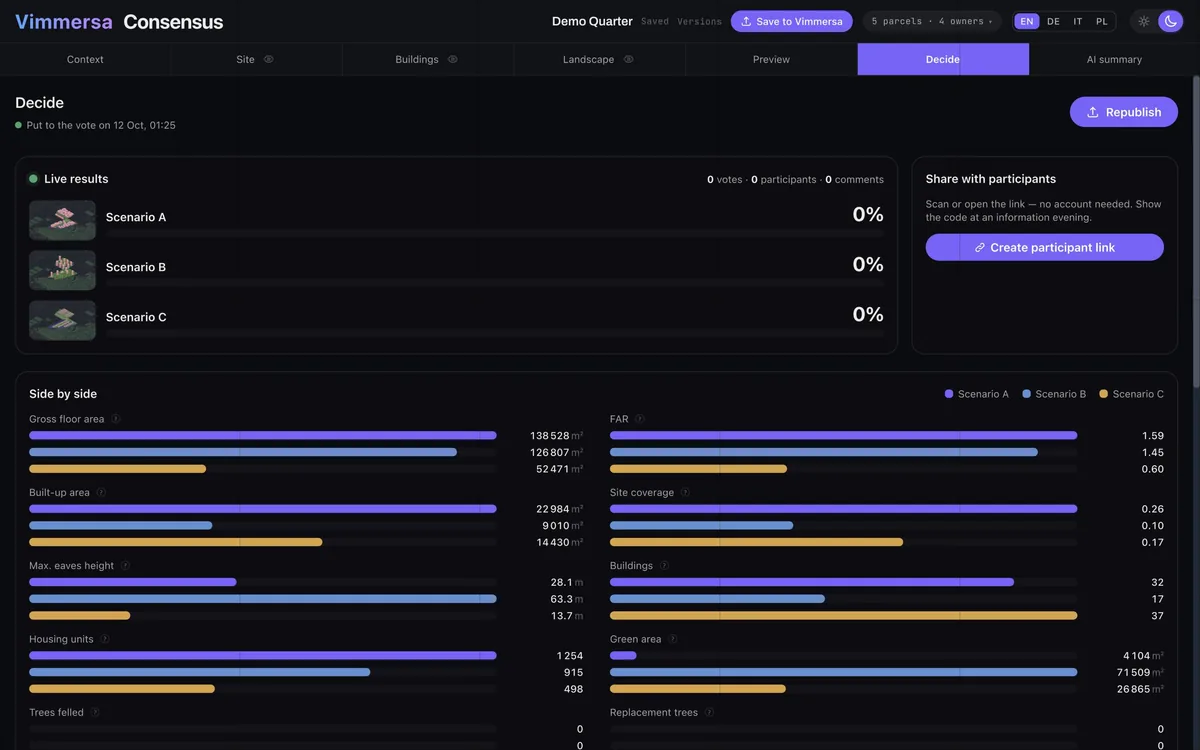
Computed as you draw, for every scenario — the same numbers participants see on each option.
| Demo Quarter | ABlocks & square | BTowers in a park | CGarden quarter |
|---|---|---|---|
| Gross floor area (BGF) | 138,528 m² | 126,807 m² | 52,471 m² |
| Floor area ratio (GFZ) | 1.59 | 1.45 | 0.60 |
| Built-up area | 22,984 m² | 9,010 m² | 14,430 m² |
| Site coverage (GRZ) | 0.26 | 0.10 | 0.17 |
| Highest eaves | 28.1 m | 63.3 m | 13.7 m |
| Buildings | 32 | 17 | 37 |
| Dwellingsestimated from residential floor area | ≈ 1,254 | ≈ 915 | ≈ 498 |
| Green space | 4,104 m² | 71,509 m² | 26,865 m² |
| Sealed surface | 41,016 m² | 20,416 m² | 26,347 m² |
| Solar green roofs | — | — | every building |
A is the densest and the most built-over; B builds almost as much floor area on a tenth of the ground and gives the rest to a park; C builds a third as much, low, with gardens and solar roofs — the trade-off the vote is about.
Two tools, one decision
Masterplan is where the options are designed. Consensus is where people choose between them.
Masterplan
Early accessDesign the options
A planning workspace in the browser: context, site, buildings, landscape and preview, on real city data.
- Official data for Vienna and Italy, OpenStreetMap elsewhere
- Plots with owners, buildings with storeys, uses and roof forms
- GRZ, GFZ, gross floor area, dwellings and use mix as you draw
- Plan, 3D, panorama and walk cameras; PDF plans as overlays
- Versions, undo and autosave — on desktop, tablet and phone
Consensus
Early accessDecide together
Puts the scenarios in front of the people they affect — and records what they chose and why.
- Publish every scenario with its views, 360° panoramas and figures
- One participant link — no account, no install
- One vote per person, which they can change
- Comments on each scenario and on the proposal as a whole
- Each scenario’s 360° opens in the Vimmersa tour
Where it is going
Masterplan and Consensus are in early access. Next: official data for more cities, CAD and BIM import, an export of the results, an AI summary of what participants said, and shadow, climate and traffic analysis through specialist partners.
Live today
On the roadmap
Questions
Do participants need an account?
No. They open the participant link in any browser. Each person has one vote, which they can change; participants who are not signed in are counted once per browser.
What do participants see?
Every scenario side by side: pictures from the same saved viewpoints, 360° panoramas that open in the Vimmersa viewer, and six key figures — gross floor area, GFZ, built-up area, GRZ, eaves height and number of buildings.
Can people see the scenarios in VR?
Yes. Every scenario’s 360° panoramas open in the Vimmersa viewer, which runs in VR headsets such as Meta Quest as well as on phones and laptops — participants open them from the vote page. Walking the full 3D model in a headset is on the roadmap; in the browser it works today.
How are the photoreal pictures made?
With Visualize: a saved view of a scenario goes to Image Studio, which renders it as an architectural visualization with the light, materials, greenery and life you choose, starting from the view’s massing and camera. It is an AI picture to help people imagine the place — check it before you publish it. Each picture uses AI credits.
Which places have official data?
Vienna: BEV cadastre and 1 m terrain, Stadt Wien zoning, building model with LoD2 roofs, tree register and land-use survey. Italy: the national cadastre, with LiDAR terrain in Emilia-Romagna and Bologna’s buildings and zoning plan. Everywhere else: OpenStreetMap buildings and streets on satellite imagery.
Can we bring our own plans?
Yes, as PDF or image: laid on the map, fitted by moving, scaling and turning it, and traced into plots and buildings. Importing CAD (DWG, DXF) and BIM (IFC) into Masterplan is on the roadmap.
What happens to the votes and comments?
They are recorded against each scenario, and the planner follows votes, participants and comments in the Decide view. A results export and an AI summary of what was said are on the roadmap.
What does a pilot include?
We set your site up in Masterplan, build up to three scenarios with your team, publish them to a protected participant link and run a workshop with your stakeholders around them.
Bring us a site
A street, a quarter or a development — we set it up in Masterplan with your team and put your scenarios to the vote.